Rasterizester
The assignment went over rasterizing points, lines, and triangles. After being able to creates shapes using points, lines and triangles, we then learned how to antialias triangles using supersampling so we could take away jaggies to create smoother images. Then we learned to transform those images so we can translate and rotate images, use that to our advantage when creating images, and manipulate already created picures by moving them around the screen or being able to zoom in and out of an image. Afterwords, we were to use barycentric coordinates to create shapes with multiple colros such as a color wheel, then used the barycentric coordinates to apply textures then apply filters. I then learned how to apply different sampling methods such as nearest pixel, bilinear, and trilinear.
Part 1: Rasterizing Lines
In part 1, I created my lines using the Bresenham's algorithm. The algorithm itself wasn't too complicated. Basically,the algorithm keeps tracks of an error value which is used to keep track if we need to add 1 to the current y index we are at while indexing through all x from x0 to x1. If two times the error is greater than dx, then we increment y by 1, if not, y does not change. This algorithm only works for slopes from 0 to 1 and the result is shown in Figure 2. Figure 2 shows that my explanation only works for one of eight octants. If dy/dx was greater than 1 or less than -1 then we would switch y and x, if x0 was less than x1 then I swapped them. Then I manipulated the algorithm depending on if slope was positive or negative and if x and y were swapped. After applying this, I was able to work with all eight octants on a graph as shown in Figure 1.
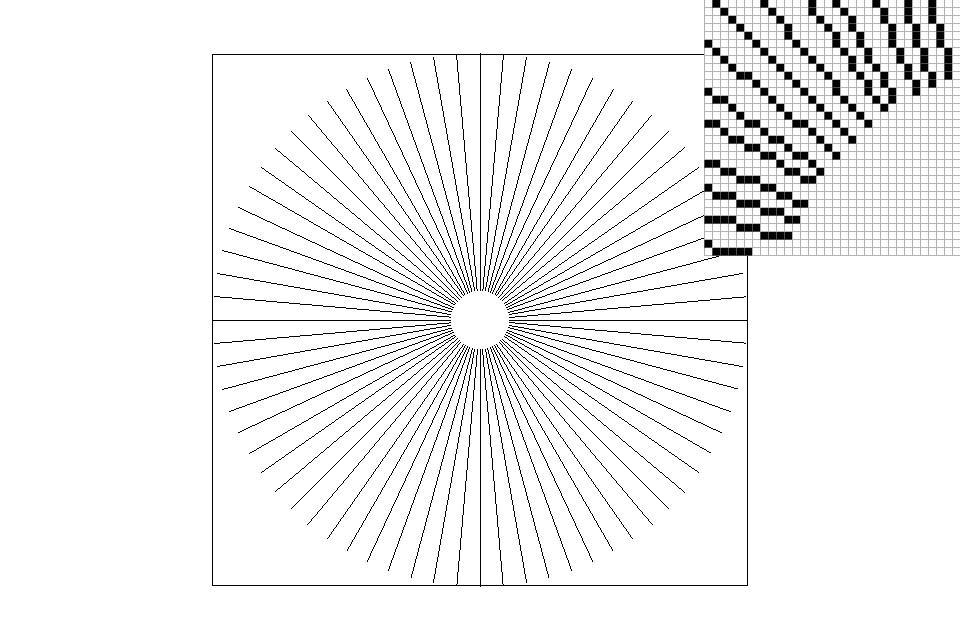
Figure 1: A series of lines with many different slopes using Bresenham's algorithm that form a sigure
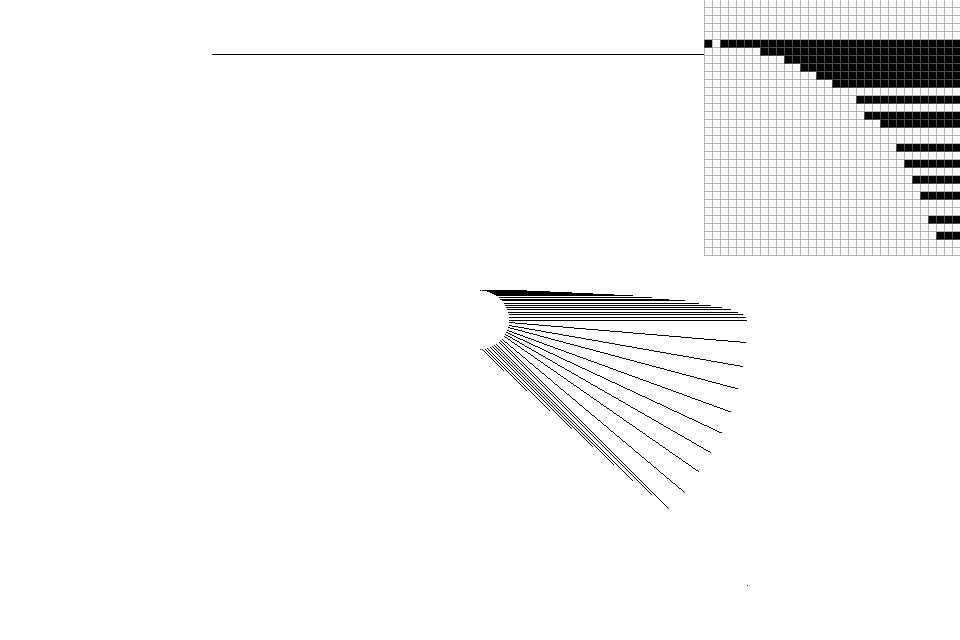
Figure 2: The same as Figure 1, but before considering the 7 other octants besides the first one when applying Bresenham's algorithm
Part 2: Rasterizing single-color triangles
In part 2, I was able to create triangles given the 3 vertices of a triangle. I was able to do this by first calculating the minimum and maximum x and y coordinates to create a bounding box that I would iterate through. I also calculated the dy and dx between each set of two points. Then, I went into a double for loop that iterated through all the y values for each x starting from the min + .5 and ending at the max + .5. I then ran 3 line equations for each iteration of x and y and if all 3 equations were greater than and equal to 0 or less than and equal to 0, then I would rasterize that pixel. I tried to optimize by using the top-left edge rules but unfortunately, even though I feel like I did account for top and left edges, according to the clock function, my top-left edge cases made rasterizing triangles slower. I'm assuming it was because my cases gave too much overhead. So I stuck with the bounding box. While working through this part, I realized a lot of bugs overtime. One of the bugs that really gave me problems was when I thought I was finished with part 2 and did part 3 and 4, so I was showing off the hard I did to a friend. I went from the normal 960x640 resolution that pops up when I run rasterizester to full screen on my macbook pro which is at a 1440x900 resolution. Then I moved to the picture of the eventual color wheel which looked fine at a lower resolution as shown in Figure 4, but it had a weird line in Figure 5. I spent a couple days trying to figure this out then I realized the problem was my line equations. Initially my line equations looked like
l0 = (x - x0) * (y1 - y0) - (y - y1) * (x1 - x0)After looking at the lecture slides again, I realized it should've been
l0 = (y - y1) * (x1 - x0) - (x - x0) * (y1 - y0)
Even though it was just the negative of what they gave in lecture, it gave me that line that just wouldnt fill itself at higher resolutions. I'm still confused on why that occured because in my conditions I checked if all my line equations were greater than and equal to 0 or if all my line equations were less than and equal to 0.

Figure 3: Rasterized triangles, top right is zoomed to show jaggies
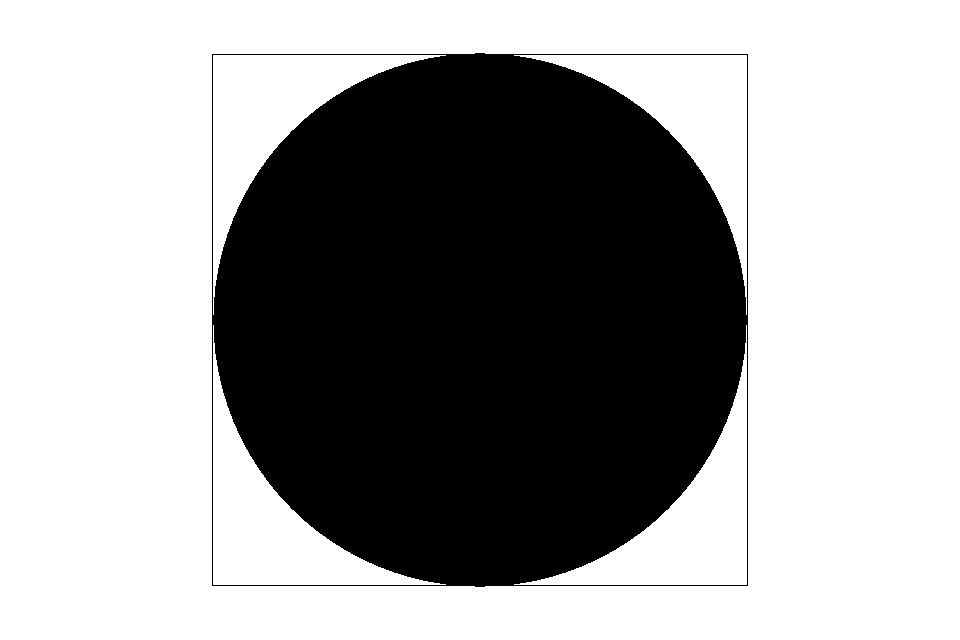
Figure 4: Circle at 960x640 resolution
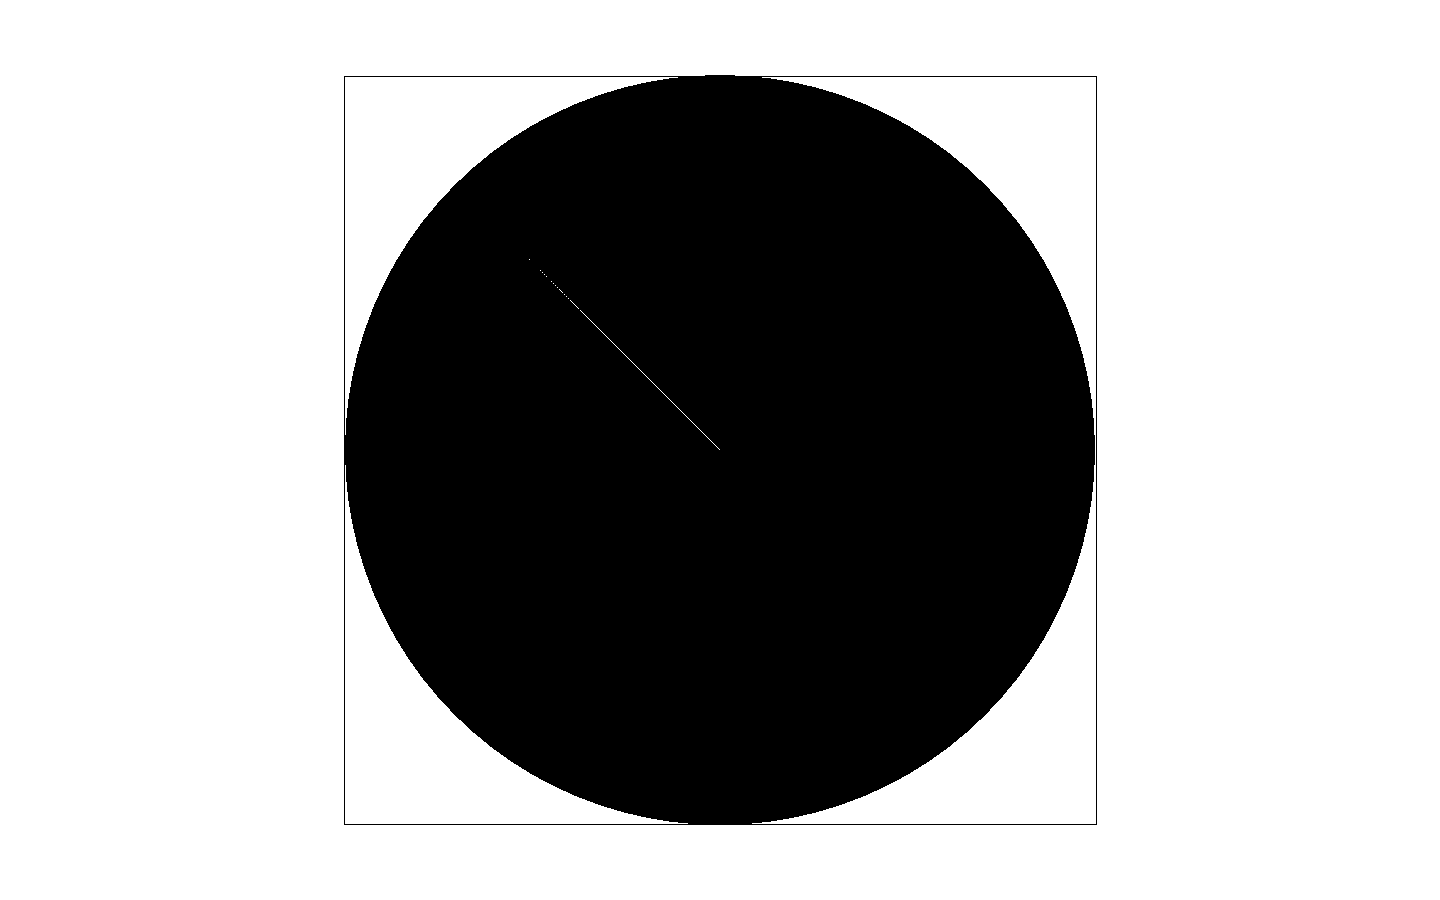
Figure 5: Circle at 1440x900
Part 3: Antialiasing triangles
In part 3, we implemented antialiasing into our triangle function to get rid of jaggies by adding less opaque pixels around the edges to make them smoother. The way I approached this was by adding a super sampling buffer that was the sample rate times bigger than the framebuffer. I kept track of that super sampling buffer size by storing a total_sample_pts integer that constantly updated with a new sample rate by doing
total_sample_pts = width * height * sample_rate
Along with adding a super sampling buffer and a integer that keeps track of the size the buffer should be, I also added the square root of the sample rate as well because later when we use the rasterize triangle function on sample rates greater than 1, we need to multiply each x and y point from the input by the square root of the sample rate and multiply the square root of the sample rate by the height and the width to get a updated height and width. After using rasterize triangle and getting the shapes and lines into the supersampling buffer, in a resolve function, I incremented through the super sampling buffer and stored each pixel from the super sampling buffer into the frame buffer. Each pixel from the frame buffer will get a sample rate's worth of pixels put into it. Only 1 sample rates worth of each super sampling pixel's color will be put into the corresponding pixel of the framebuffer. For example, if the sample rate was 4, 4 pixels of the super sampling buffer will be put into 1 pixel of the frame buffer and each super sampling pixel wil only have 1/4th of it's r,g,b,a colors put into the corresponding frame buffer pixel. The figures below show the difference between different sample rates. The last figure, Figure 9, shows the background as gray. The problem there was that I was adding all the elements from the supersampling buffer divided by the sample rate straight into into the framebuffer. That would make my screen grayer. So what I did to change that was I began to add all the elements from the supersampling buffer into a integer variable before dividing by the sampling rate and storing it into the framebuffer and that fixed my problem. Fixing this caused Figure 9 to become Figure 8.
Figure 6: Triangles at sample rate at 1 pixel
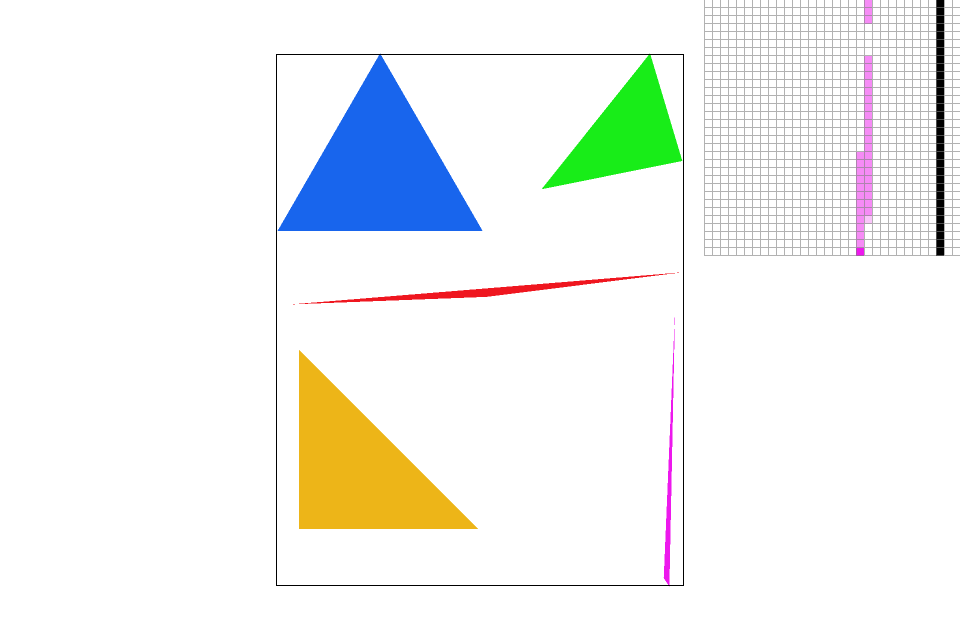
Figure 7: Triangles at sample rate at 4 pixel
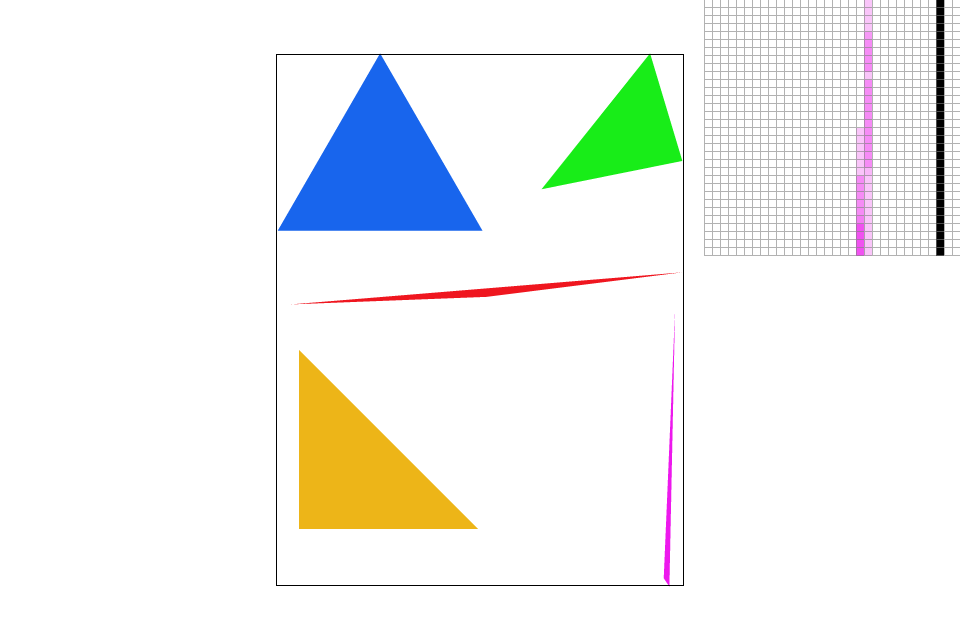
Figure 8: Triangles at sample rate at 16 pixel
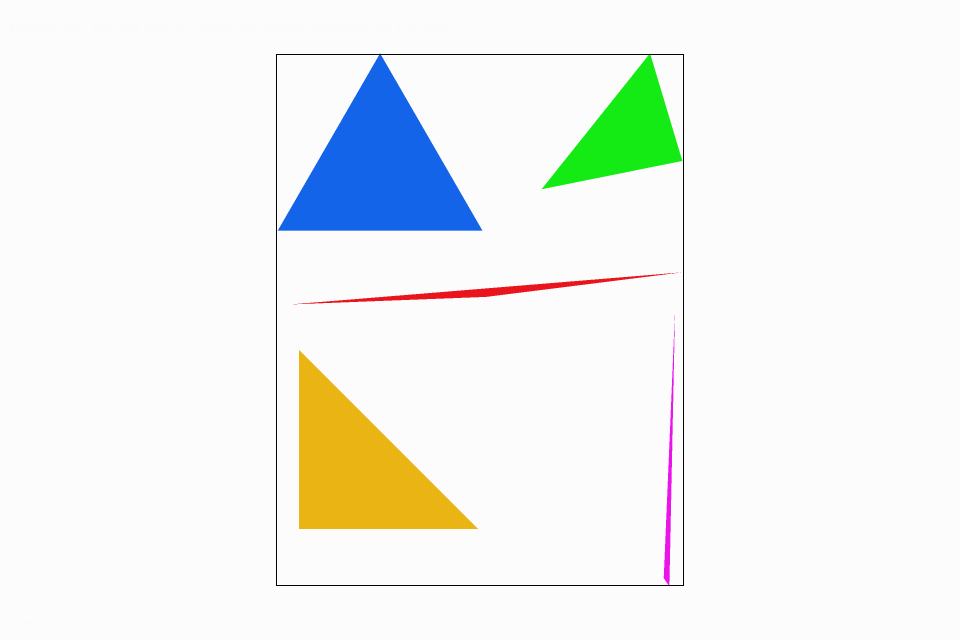
Figure 9: Same as Figure 8, but with a gray background due to problem in code
Part 4: Transforms
In part 4, I was able to move the images in the UI around the screen through translation and zoom in and zoom out by scaling. I also implemented translate, scale, and rotation functions using matrices. Since I was working with 2D coordinate spaces, I needed 3x3 matrices to account for homogeneous coordinates. In my examples I created a robot using rectangles. The order I made the robot move actually goes backwards from Figure 14 to Figure 10. For entertainment, I put them in reverse order to make it look like the robot waves then walks towards the screen. From Figure 14 to Figure 13, I translated the right leg up. From 13 to 12 the right leg went back down and the left leg went up then I scaled the whole image down to make him seem farther away. From 12 to 11, I moved the left leg down I grouped up the left arm so that they all move together. I translated that arm to the origin then rotated it 180 degrees so his arm goes up as if he is waving, then I translated it back. However, since the pivot went from the bottom left to the bottom right of the shape, I didnt translate it back to the exact same spot or else it would be too far right. Lastly, 11 to 10, I do the opposite of what I did from 12 to 11, I just took out the translation and rotation from of the arm from 11 and moved the left leg back down. I did these operations to simulate movement, but also to move the whole heirarchy around while moving a group within the heirarchy around.
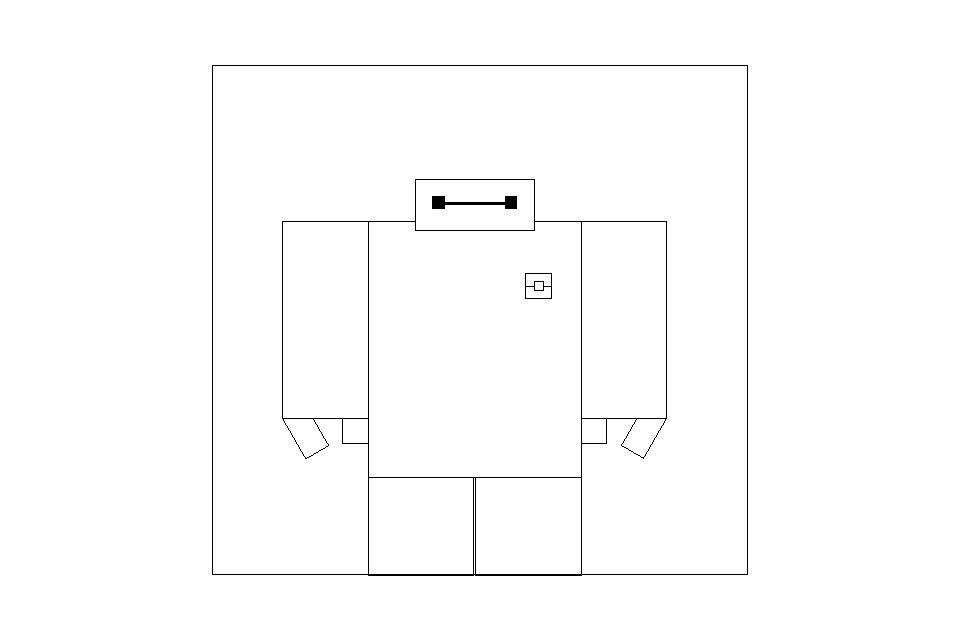
Figure 10: Scaled smaller robot.
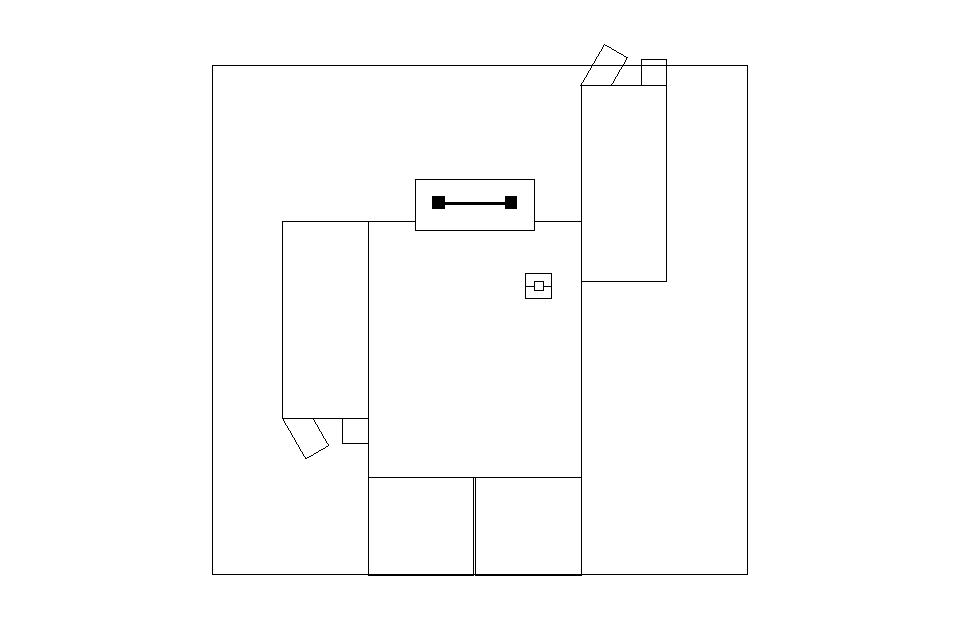
Figure 11: Robot's left arm rotated around the origin then moved back over. He says "hi!"

Figure 12: Translation of the left leg up.
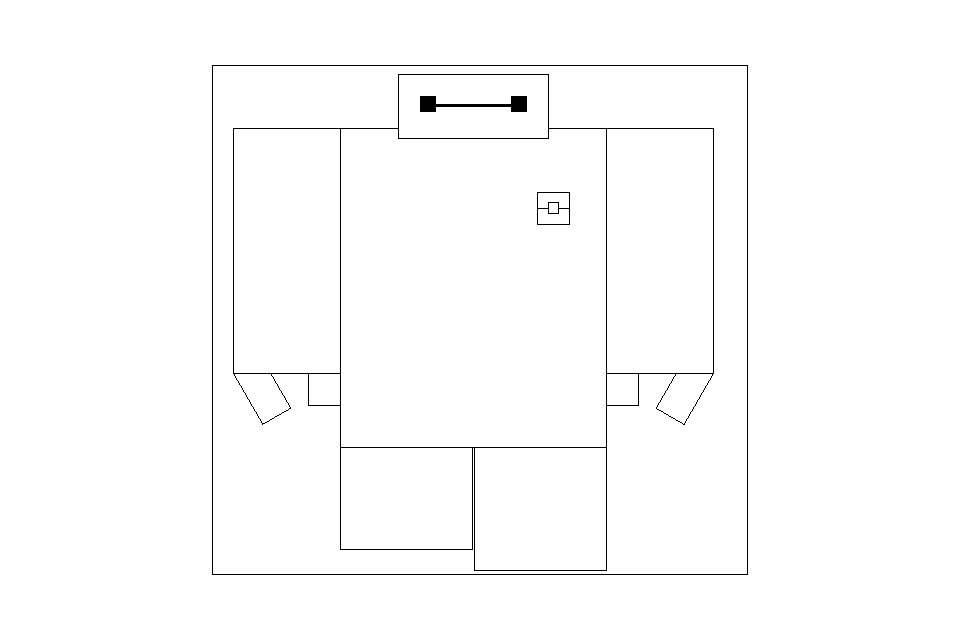
Figure 13: Original size and translation of right leg up.

Figure 14: Original robot. Series of pictures looks like he's stepping towards you.
Part 5: Barycentric coordinates
In part 5 we implemented barycentric coordinates in order to create shapes that gradually change colors throughout the shape. So these shapes are one consistent color as shown in Figure 15 and 16. Barycentric coordiantes is a coordinate system created by 3 points a, b, and c. One point, a, is marked as the origin and the vectors from a to b and from a to c act as basis vectors so a nonorthognal coordinate system will be formed. Since barycentric coordinates are made up of the 3 points, the three points will always make a triangle such as the triangle in Figure 15 where one vertex is a, one is b, and the other is c. We can represent a point of barycentric coordinates in terms of α, β, and γ. The sum of α, β, and γ will always be one. So if we find 2 of those points we can always find the other 1 by subtracting the other two by 1. For example we can get γ by doing
γ = 1 - α - β
To get each coordinate we just get 1 minus the distance from a vertex. For example, if our point is p, to get the α coordinates with an origin of a. We just find the distance, d, between a and p and subtract 1 from that to get a distance α.
α = 1 - d
The same applies for β and γ, but with b and c. That means the closer a point is to a vertex, the closer the corresponding coordinate is to 1. That also applies to finding a point's color. We take a weighted average between it's distance from each vertex. So we interpolate between the 3 vertices using barycentric coordinates to calculate the color. In my code I did
p = (a * α) + (b * β) + (c * [1 - α - β])
where p ends up being the color. That's why points closer to the red vertex are more red, the points closer to the blue vertex are more blue, the points closer to the green vertex are more green, and the colors inbetween as the mix of red, blue, and green. After using the math, I created a color wheel that has reds, blues, greens, and all the colors in between as shown in Figure 16. Once understanding the concept, the application was easy. In my drawrend.cpp file, I created α and β by doing
α_numerator = (y - y1) * (x2 - x1) - (x - x1) * (y2 - y1)
α_denominator = (y0 - y1) * (x2 - x1) - (x0 - x1) * (y2 - y1)
α = α_numerator / α_denominator
β_numerator = (y - y2) * (x0 - x2) - (x - x2) * (y0 - y2)
β_denominator = (y1 - y2) * (x0 - x2) - (x1 - x2) * (y0 - y2)
β = β_numerator / β_denominator
Then I get γ and p in svg.cpp as I did in the equations shown above then used p to get a color which was placed on the corresponding (x, y) point I was originally given.
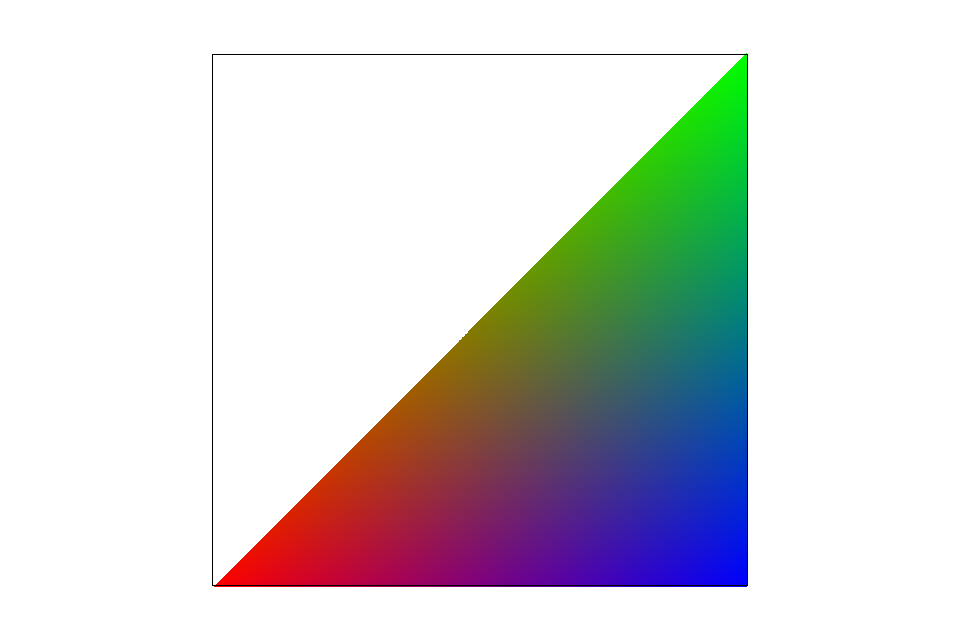
Figure 15: A triangle made using barycentric coordinates
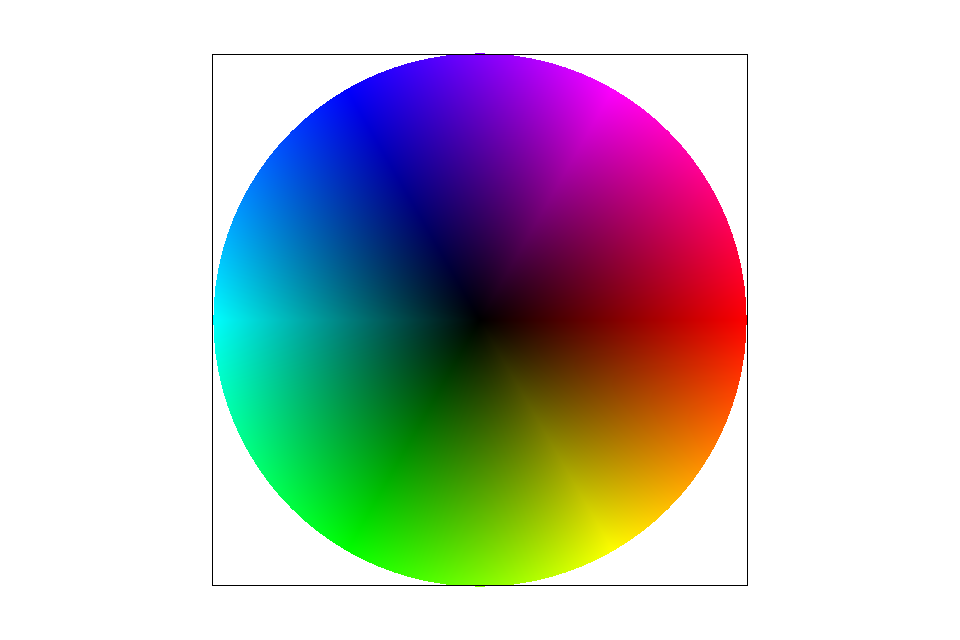
Figure 16: A color wheel made using barycentric coordinates
Part 6: Pixel sampling for texture mapping
In part 6 I applied the nearest pixel and bilinear sampling methods. In the nearest pixel sampling method, I found the nearest pixel by multiplying my u coordinate by the width of the mipmap at a specific level, then added point .5, then got the floor of that number. I added .5 because if the number was closer to the lower number, adding .5 then flooring it would cause it to become the lower number. If it was closer to the higher number, adding .5 would bring a whole number higher, then flooring it would give it the higher number. I then applied that to the v coordinate by multiplying v by the height, adding .5, then flooring it. The reason I multiplied u and v by the width and height is because u and v are both between 0 and 1 because we got them the same way as we got the barycentric coordinates. After that. I found the index in a specific MIP map level and took the color from that index. For bilinear it was a little more complicated. Since I am getting a weighted combination of the four pixels surrounding my uv coordinate, I had to find the distance for each of the pixel in the u and v direction from the point given, multiply 1 minus distance between a pixel in the u direction by 1 minus a pixel in the v direction. Then I multiply 1 minus that number by the color of that given pixel. I do that for each of the 4 pixels surrounding a point, add those together, then I get a color which I return. Drawrend.cpp supplies which sampling method I would be using and svg.cpp uses the α, β, and γ from drawrend.cpp to calculate the uv cooridnates. Those uv coordinates are used in the nearest pixel and bilinear sampling methods. Figure 17 and Figure 18 show the difference between a portion of a map when zoomed into a specific portion. It is obvious that Figure 18 and bilinear sampling provides a much better picture up close. So bilinear sampling should be used in comparison to nearest pixel sampling when given a pixelated photo. The results will turn out like Figure 17 and Figure 18. In photos without many varying colors, where the picture has few changes in color, or has a high sampling rate the nearest versus bilinear sampling won't be relevant because it is more likely that all of a point's surrounding pixels might be the same. So the results would be the same from either version of sampling.

Figure 17: Nearest pixel sampling of a map zoomed into the Philippines exposes individual pixels

Figure 18: Same map, but since it is with the bilienar sampling method, it is noticeably blurry, but the pixels blend well to create a better picture
Part 7: Level sampling with mipmaps for texture mapping
In part 7, I used what I did in part 6, but added more to it. In drawrend.cpp, I also get the barycentric coordinates for a point greater in the x direction by 1 and get the barycentric coordinates for a point greater in the y direction by 1 as well. I use svg.cpp to convert those in uv coordinates like I did in part 6. In part 6, we assumed that the MIP map level was at zero. But now, we have a setting to determine if we are sampling at level 0 or a different level. A MIP map is a series of textures that are based on resolution. The higher the level, the lower the resolution. The resolution of a specific level is usually half of it's previous one. So lets say level 7 mip map will be a resolution of 128x128, a level 6 mip map will have a resolution of 256x256. To determine what level we are working at, we first find L.
L = max(√((du/dx)^2 + (dv/dx)^2), √((du/dy)^2 + (dv/dy)^2)
We then calculate D, the log base 2 of L
D = log(L)
where D is our MIP mapping level. So after finding the level, we can now apply that to the bilinear and nearest sample functions. Figure 19, 20, 21, and 22 compare the different filters. Figure 19 and 21 show 0 level MIP mapping and the images are good. However, when changing the MIP mapping level in Figures 20 and 22, the images look much cleaner, but a little blurrier as well. I also created a case for bilinear interpolation of the level. We get the sampling at the current integer level and the level higher. We then add the weighted values of each of the results depending on how far the float value of the level is compared to the current and higher level. It creates trilinear sampling when doing bilinear sampling with bilinear interpolation. An example of that can be seen at Figure 23. I also zoomed into one of the Starcraft units in Figure 24 and 25 to see the difference between sampling up close and the bilinear sampling made the pixelated nearest sampling image much cleaner.
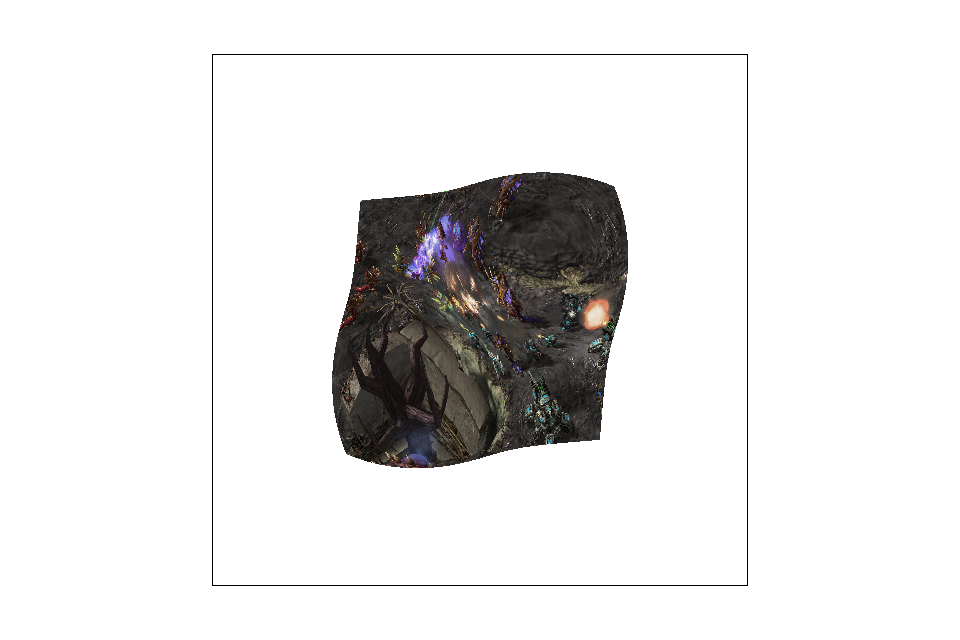
Figure 19: Scene from Starcraft II with level 0 MIP mapping and using nearest pixel sampling
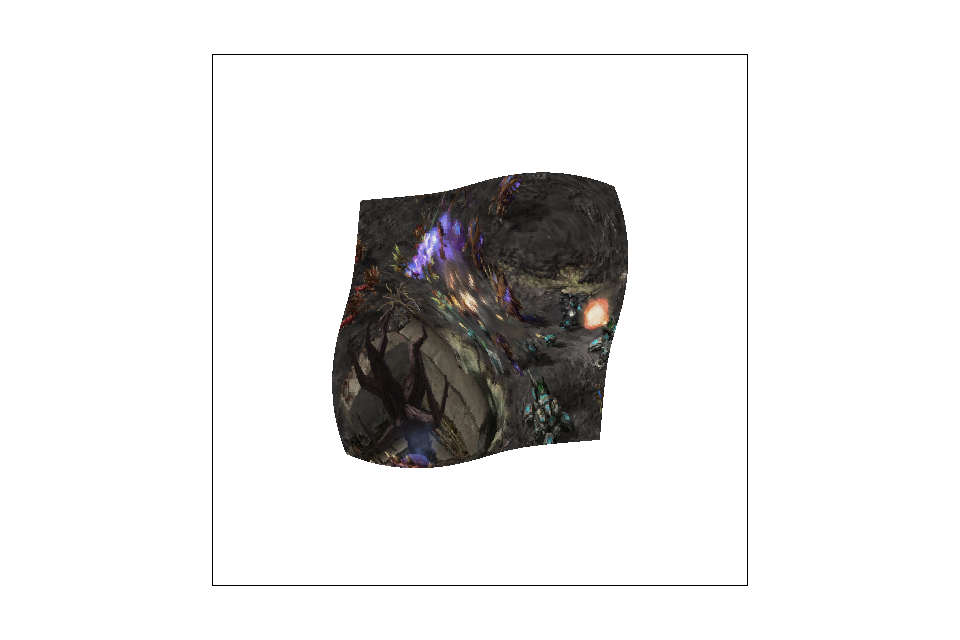
Figure 20: Calculated level MIP mapping using nearest pixel sampling
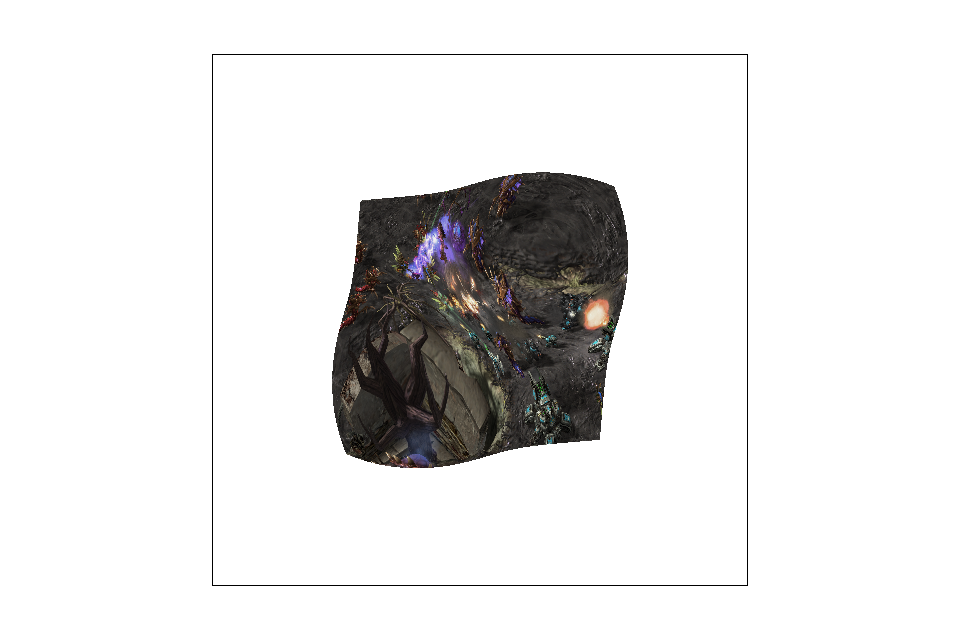
Figure 21 Level 0 MIP mapping using a bilinear filtering

Figure 22: Calculated level MIP mapping using a bilinear filtering
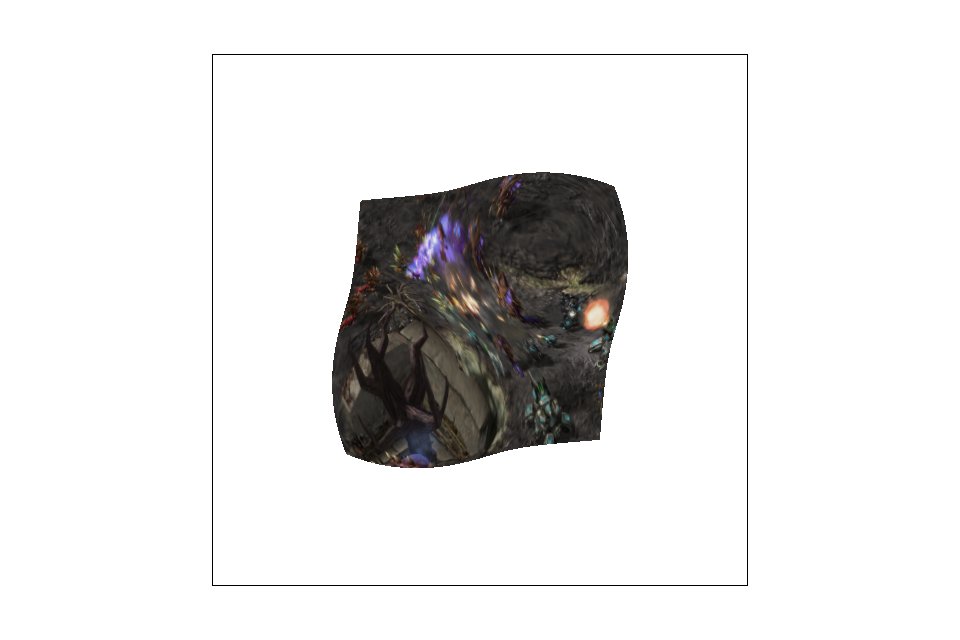
Figure 23: Calculated level MIP mapping using a trilinear filtering
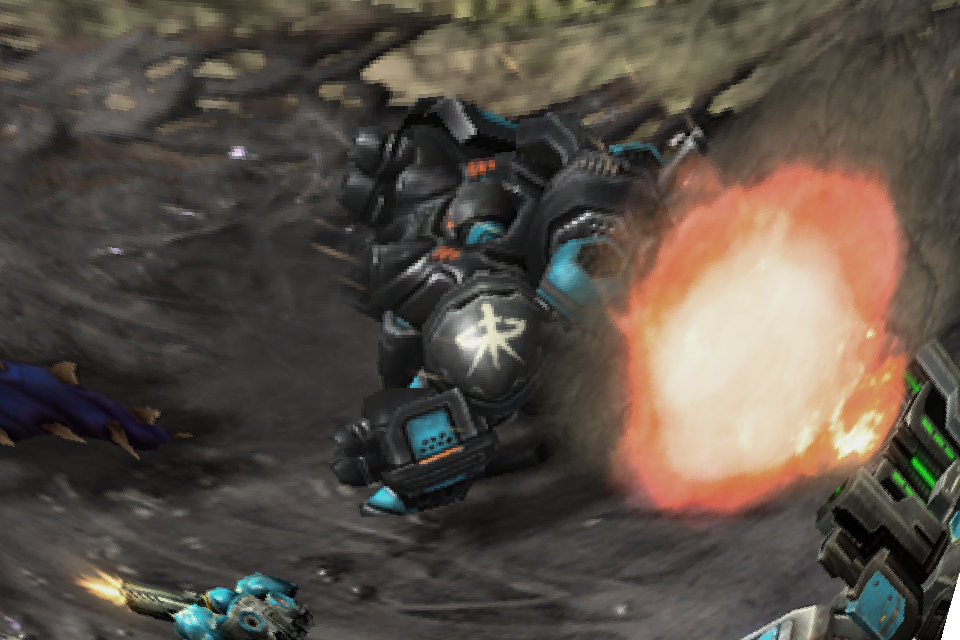
Figure 24: Zoomed nearest pixel sampling
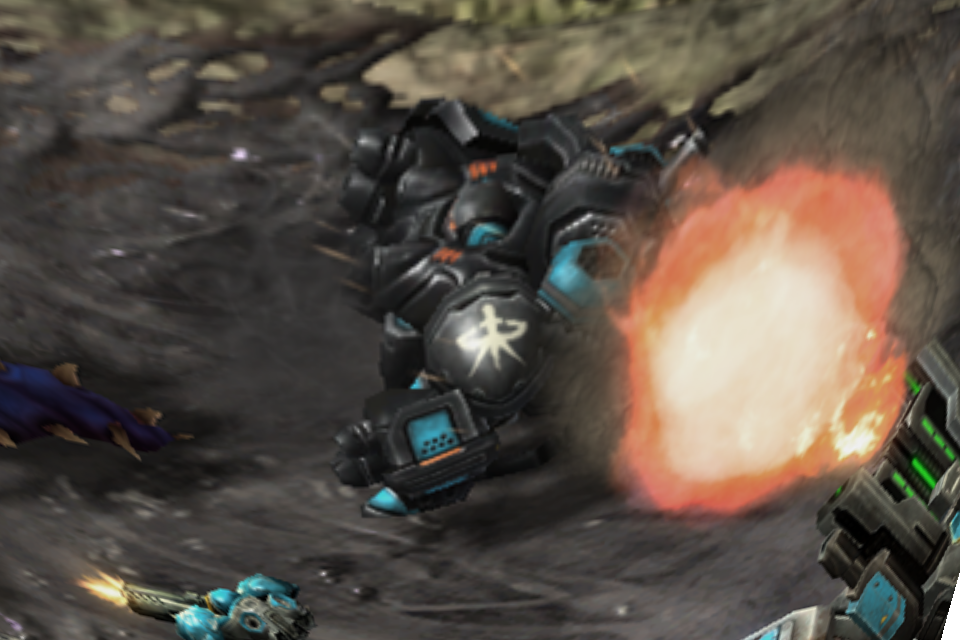
Figure 25: Zoomed bilinear filtering
Part 8: My drawing
I created a Stormtrooper from the original Star Wars trilogy based off of a drawing I made of one before which is in Figure 26. However, my Stormtrooper drawing doesnt have symmetry while I wanted my computer creation to have it. The symmetry made it easier because I could just have the left side reflect over the midpoint, 400 pixels, and create a mirror image as you can see in Figure 27. I didn't think of symmetry until after I completed the top of the helmet. That is why I have triangles that cross over the midpoint. Furthermore, the only shape I used was triangles. The overall process took me about 20 hours or so just because I changed my idea about 2 or 3 times and the stormtrooper itself took about 7 or 8 hours. I made sure all the triangles were conencted and there were no holes inside the Stormtrooper.After finishing the stromtrooper, a mainly white and black color looked REALLY BORING. So I made the background black to make the Stormtrooper pop and I made half its face shaded to add a nice lighting effect. If I wasn't way out of time, I would've made the shading much more of a gradient and much more beautiful. BUT OH WELL! I'm pretty happy with the results. It's very gratifying to be able to create art using my self created programs.
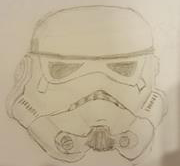
Figure 26: The inspiration for my competition creation
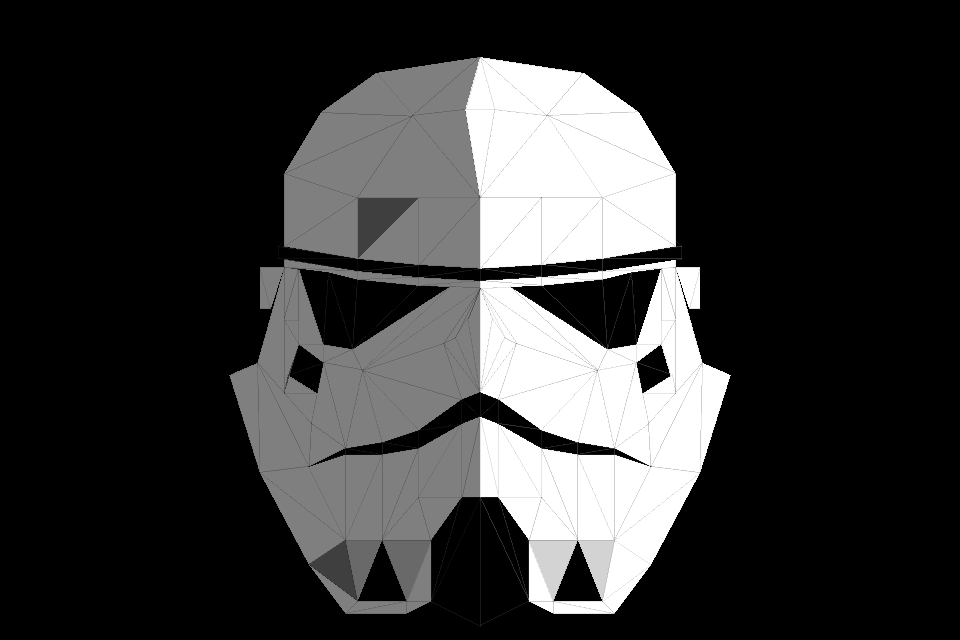
Figure 27: Stormtrooper made out of triangles